 DAAMDEKHI
Bangladesh Online Electronics Price Intelligence Report
Prepared for RFL Group / Vision Electronics e-commerce pricing team. Covering Star Tech, Gadget & Gear, Dazzle, AppleGadgets, and Pickaboo across phones, laptops, tablets, sound equipment, power & accessories, wearables, and cover & glass.
Executive Summary
The market does not have one universal price leader — it has category leaders. AppleGadgets is the clearest low-price benchmark for premium phones and tablets. Dazzle is the strongest markdown player, especially in Samsung-led flagships and accessory clearance. Star Tech is the fastest reactor, with the highest recorded repricing volume. Gadget & Gear is the calmest premium shelf, intervening selectively rather than continuously.
On the observed matched basket, AppleGadgets leads 18 of 43 disclosed lowest-price positions overall; Dazzle and Star Tech each lead 10; Gadget & Gear leads 5; and one SKU is tied.
The biggest percentage swings are not always where the biggest money sits. Across the observed matched basket, phones carry an average retailer gap of about ৳52,502 per SKU and tablets about ৳16,216, versus roughly ৳1,363–৳1,893 in power and sound accessories. Traffic and conversion should be won on hero phones and tablets, while accessories should be used mostly to shape basket value and price image.
This table distils the five most important strategic questions for Vision's e-commerce pricing team and answers each one with the evidence. Read it first; everything else in this report provides the data behind these conclusions.
| Strategic Question | What the Evidence Says | What Vision Should Do |
|---|---|---|
| Who sets the floor on premium traffic SKUs? | AppleGadgets does, especially on iPhones and tablets | Treat AppleGadgets as the parity benchmark for hero phone and tablet lines |
| Who creates the biggest promo shocks? | Dazzle, especially in cases, glass, and selected Samsung and Pixel lines | Expect sudden markdown bursts; respond selectively, not blanketly |
| Who moves prices most often? | Star Tech, with the highest total recorded price-change count | Run tighter alerting cadence on tablets, audio and selected flagship phones |
| Who behaves most like a premium shelf retailer? | Gadget & Gear, with the lowest overall change count and very few deep markdowns | Do not overreact; respond only when a hero SKU matters for conversion |
| Where is the most money at stake? | Phones first, tablets second | Put most pricing energy into those two baskets |
Retailer Price Leadership Scoreboard
Understanding what each retailer does differently is the foundation of any intelligent pricing response. This section profiles each of the five tracked retailers by their observed behaviour — not by what they claim to be, but by what the data shows they actually do. The differences are large and consistent enough to treat as structural competitive characteristics rather than week-to-week variation.
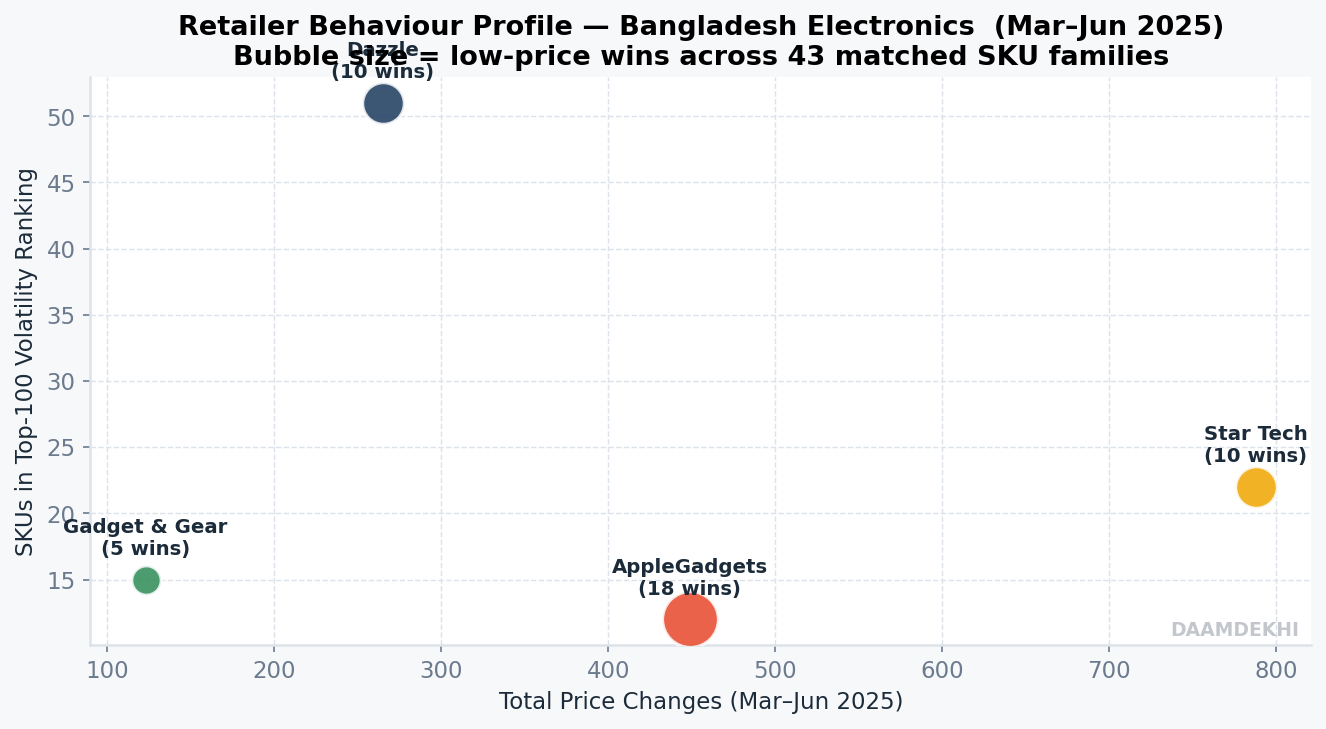
12 items in top-100 volatility list, median swing ~30.6%. Strongest where Apple phones, iPads and selected adapters matter. The benchmark for iPhones and tablets.
51 items in top-100 volatility list, 41 items above 30% swing. Especially in cases, screen protectors, Samsung and Pixel phones. Fewer but much deeper changes.
22 items in top-100 volatility list. Highest average number of changes per volatile SKU, especially in tablets, audio, and a few premium phones.
15 items in top-100 volatility list, only one item above 30% swing. Interventions are concentrated rather than continuous. Best for MacBook Air and Galaxy S24 FE.
Star Tech made 788 price changes during the observation period — more than six times Gadget & Gear's 123. That is not chaotic; that is a deliberate strategy of rapid, continuous market-following repricing designed to stay competitive without ever taking a large markdown in one move. Dazzle, by contrast, made 265 changes but had 41 items with swings above 30% — fewer, deeper cuts designed to create attention and urgency. Vision needs to monitor both behaviours simultaneously: Star Tech for early warning of emerging price movements, Dazzle for the occasional massive undercut that can reshape shopper expectations overnight.
| Category | Matched SKUs | AppleGadgets | Dazzle | Gadget & Gear | Star Tech | Leader |
|---|---|---|---|---|---|---|
| Phones | 16 | 9 | 6 | 0 | 1 | AppleGadgets |
| Tablets | 6 | 5 | 0 | 0 | 1 | AppleGadgets |
| Sound Equipment | 10 | 1 | 2 | 2 | 5 | Star Tech |
| Laptop & Desktop | 2 | 1 | 1 | 0 | 0 | Split |
| Power & Accessories | 3 | 1 | 0 | 1 | 1 | Split |
| Wearables | 5 | 0 | 1 | 2 | 2 | Split |
| Cover & Glass | 1 | 1 | 0 | 0 | 0 | AppleGadgets |
AppleGadgets dominates phones (9 of 16 low-price positions) and tablets (5 of 6) while Star Tech leads in sound equipment (5 of 10). These are not random outcomes — they reflect each retailer's strategic focus. Vision should treat AppleGadgets as the benchmark it must be close to on every iPhone and iPad SKU, and Star Tech as the benchmark in audio accessories. Gadget & Gear does not lead in any major category by low-price wins, but its stable premium positioning makes it the most useful reference for what the premium price ceiling looks like — the point above which Vision should not let its own prices drift.
Top 30 SKUs by Cross-Retailer Spread
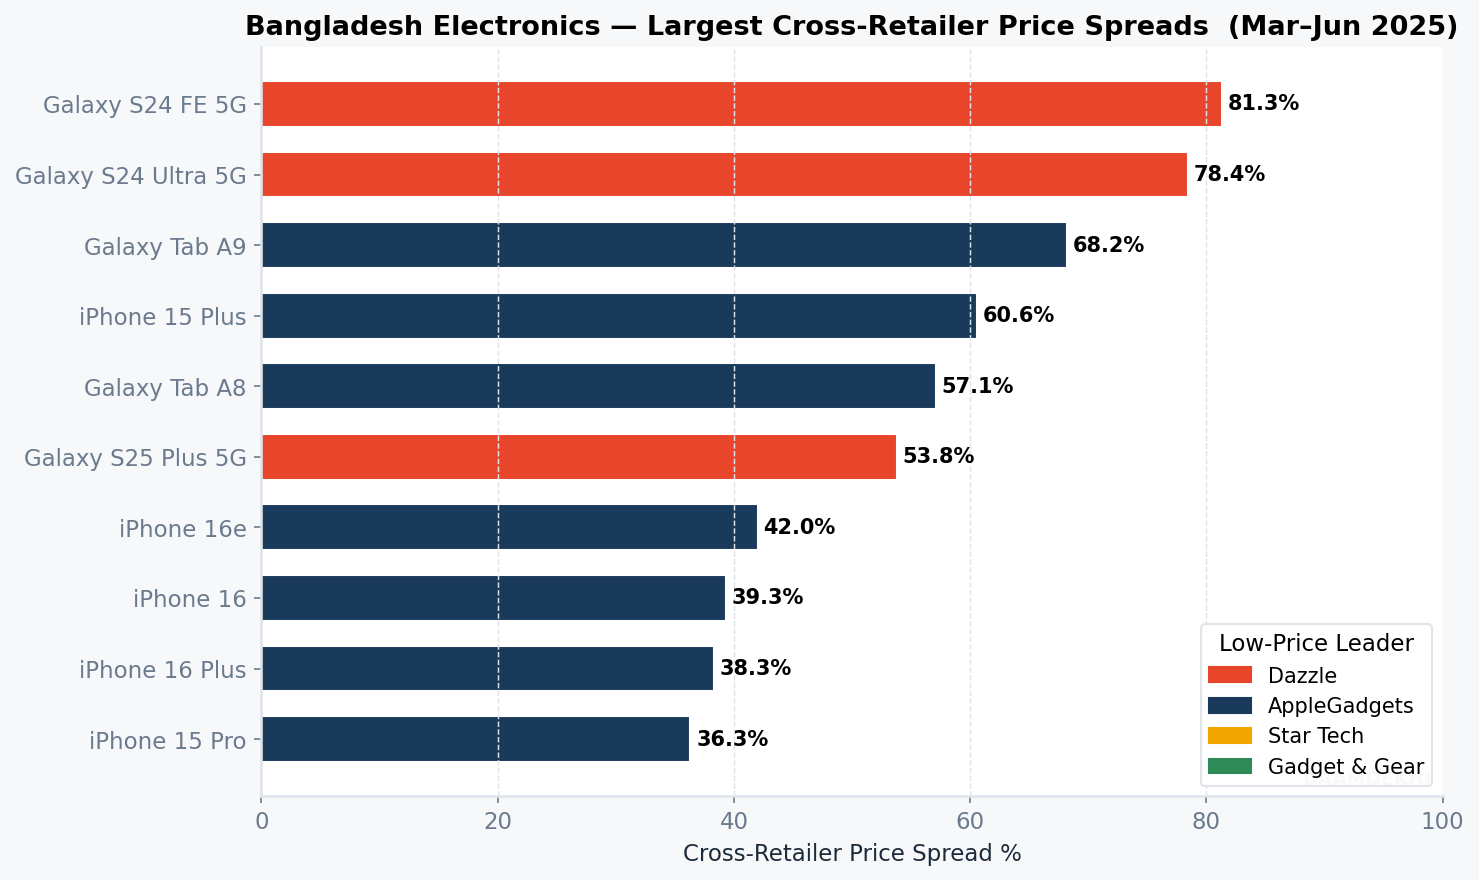
The spread table shows where the same electronics product costs the most dramatically different amounts depending on which retailer a shopper uses. A 81.3% spread on Samsung Galaxy S24 FE means the difference between the cheapest and most expensive observed price is larger than the cheapest price itself. In taka terms, that is a difference of ৳74,010 for the same phone. These are the SKUs where getting the pricing right generates the most commercial impact — and where getting it wrong is most visible to shoppers.
The top-thirty spread basket is dominated by phones (16 of 30 largest observed dislocations). Average spread: 39.7%. Average absolute gap: ৳32,660.
| Rank | SKU | Category | Low Retailer | Spread | Gap (৳) |
|---|---|---|---|---|---|
| 1 | Xiaomi 120W GaN USB C Charger with Type C Cable | Power & Accessories | Gadget & Gear | 96.6% | 2,801 |
| 2 | Samsung Galaxy S24 FE 5G | Phones | Dazzle | 81.3% | 74,010 |
| 3 | Samsung Galaxy S24 Ultra 5G | Phones | Dazzle | 78.4% | 131,600 |
| 4 | Galaxy Tab A9 | Tablets | AppleGadgets | 68.2% | 18,099 |
| 5 | Clear Magnet Case for Galaxy S25 Ultra | Cover & Glass | AppleGadgets | 66.3% | 1,489 |
| 6 | iPhone 15 Plus | Phones | AppleGadgets | 60.6% | 85,999 |
| 7 | Galaxy Tab A8 | Tablets | AppleGadgets | 57.1% | 15,999 |
| 8 | Samsung Galaxy S25 Plus 5G | Phones | Dazzle | 53.8% | 82,000 |
| 9 | Apple AirPods 3rd Generation | Sound Equipment | Dazzle | 48.6% | 9,000 |
| 10 | iPhone 16e | Phones | AppleGadgets | 42.0% | 41,000 |
| 11 | iPhone 16 | Phones | AppleGadgets | 39.3% | 50,499 |
| 12 | XINJI Nothing 2 Smart Watch | Wearables | Star Tech | 39.1% | 1,700 |
| 13 | iPhone 16 Plus | Phones | AppleGadgets | 38.3% | 52,999 |
| 14 | iPhone 15 Pro | Phones | AppleGadgets | 36.3% | 56,500 |
| 15 | iPhone 16 Pro Max | Phones | AppleGadgets | 34.8% | 67,999 |
| 16 | iPhone 15 | Phones | AppleGadgets | 33.5% | 36,999 |
| 17 | iPhone 16 Pro | Phones | AppleGadgets | 32.1% | 53,499 |
| 18 | Galaxy Tab S10+ | Tablets | AppleGadgets | 30.8% | 39,999 |
| 19 | Apple World Travel Adapter Kit | Power & Accessories | AppleGadgets | 28.4% | 1,190 |
| 20 | iPad mini 7 | Tablets | AppleGadgets | 27.7% | 18,999 |
| 21 | OnePlus 13 | Phones | Star Tech | 27.6% | 31,800 |
| 22 | iPhone 15 Pro Max | Phones | AppleGadgets | 26.1% | 43,999 |
| 23 | Google Pixel 9 | Phones | Dazzle | 24.0% | 18,410 |
| 24 | Yison Celebrat SP-8 Portable Bluetooth Speaker | Sound Equipment | Star Tech | 23.4% | 289 |
| 25 | Apple AirPods 2nd Generation | Sound Equipment | Dazzle | 20.8% | 3,009 |
The Samsung Galaxy S24 Ultra has a ৳131,600 absolute gap between the cheapest and most expensive observed price across retailers — making it the single largest taka-value pricing dislocation in the dataset. In plain terms: a shopper who buys the S24 Ultra at the wrong retailer could be paying over one lakh taka more than a peer who shops around. For Vision, this is both a warning and an opportunity. The warning is: if Vision is consistently on the expensive side of this gap on high-profile phones, it is losing high-value buyers to Dazzle. The opportunity is: because the gap is so large, being close to the floor on just two or three hero Samsung SKUs could meaningfully shift conversion among high-intent shoppers.
Launch-to-Decay Patterns
Electronics prices do not stay stable after launch — they decay as newer models arrive, as initial stock premiums fade, and as retailers compete for remaining demand. Understanding how quickly different product families decay, and which retailers accelerate that decay, is essential for Vision's markdown timing and inventory management decisions. The patterns below are based on observed Bangladesh market data, not global assumptions.
| Family | Age During Mar–Jun 2025 | Observed Bangladesh Pricing Pattern |
|---|---|---|
| iPhone 15 line (Sept 2023) | About 19–21 months (late cycle) | Spread ranges from 26.1% to 60.6%; still heavily fragmented across retailers. Non-Pro and entry-premium Apple lines are conversion weapons. |
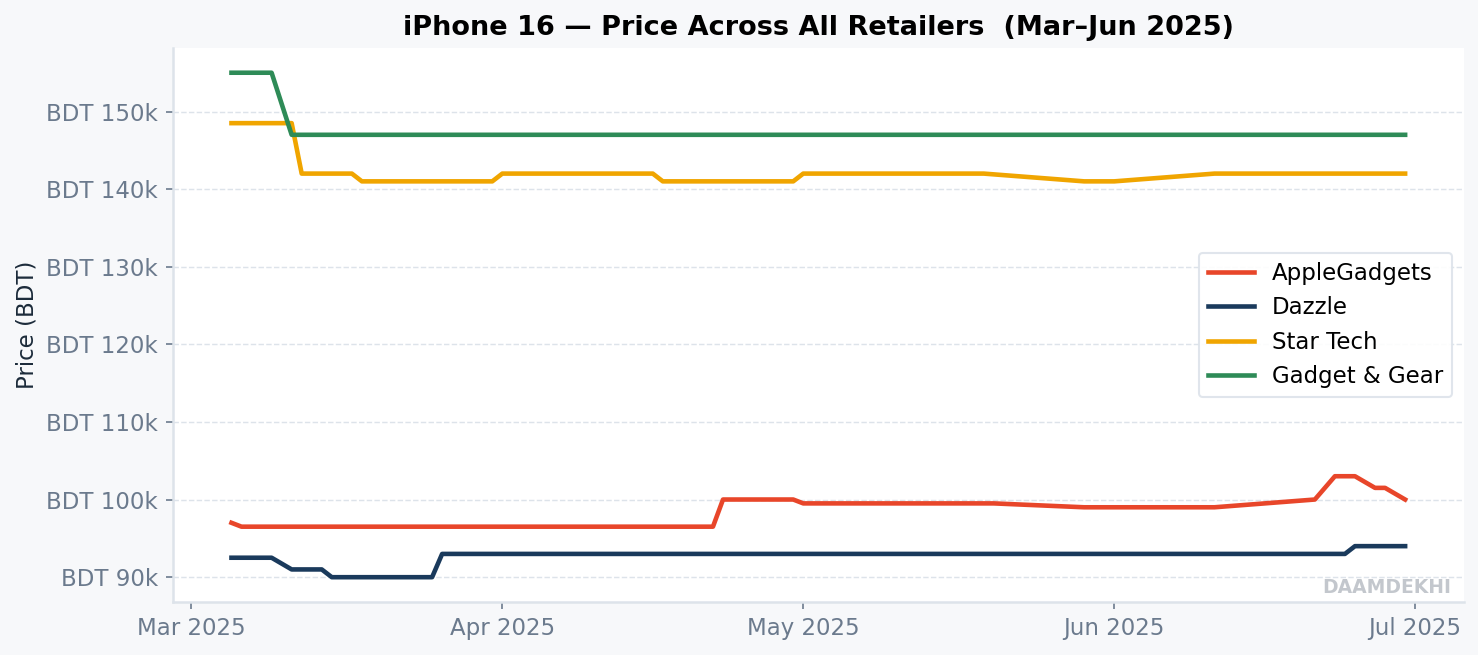
| iPhone 16 line (Sept 2024) | About 2–9 months (mid cycle) | Spread ranges from 32.1% to 42.0%. iPhone 16e shows the fastest early decay — 31.7% within AppleGadgets over 87 days with 7 price changes. |
| Galaxy S24 line (Jan 2024) | About 7–17 months | S24 FE shows 81.3% spread, S24 Ultra 78.4%. Samsung flagships should be managed as event-driven traffic anchors, not static-margin lines. |
| Galaxy S25 line (Jan 2025) | About 3–5 months (early cycle) | S25 Plus already shows 53.8% spread only months after launch. Market is willing to break into very different price corridors well before lifecycle matures. |
| Pixel 8 and 9 lines | About 1–21 months | Pixel 8 Pro at 12.9%, Pixel 9 at 24.0%, Pixel 9a at 5.7%. Tighter pricing corridor than either iPhone or Galaxy — selective arbitrage opportunity on Pixel 9. |
The Galaxy S25 Plus launched in January 2025 and by March–June it already had a 53.8% cross-retailer spread. That means within three to five months of launch, a flagship Android phone that originally sold at a tight premium had already fragmented dramatically across retailers. This is a pattern Vision can plan around: Samsung flagships need active markdown planning from month three onwards, not month nine. Waiting until inventory pressure forces a reactive cut is more damaging to margin than a planned, early-cycle tactical price move that keeps Vision competitive before Dazzle dominates the discount narrative.
Demand Pockets Ahead: 4–8 Weeks
These demand pockets represent the areas where Vision should concentrate its pricing attention and inventory positioning in the next four to eight weeks. They are chosen based on observed spread size, retailer repricing activity, and category-level conversion opportunity — not on which categories are most comfortable to manage.
S24 FE, S24 Ultra and S25 Plus show the largest Android dislocations. Watch Dazzle first, then Star Tech. Be close to the leader on hero colours and configurations.
iPhone 15 carryover and iPhone 16e/16 still show wide spreads. Match the floor on entry and mid-tier Apple traffic models; hold more margin on Pro Max.
Galaxy Tab A9/A8, iPad mini 7, and iPad Air M3 show strong price gaps and active repricing. Use value bundles with stylus, covers and chargers rather than only cash markdowns.
AirPods, Yison and Marshall lines show steady but meaningful room for bundle-driven conversion. Use phone-plus-audio bundles and cart-level coupons instead of naked unit discounting.
Cases and glass move hard at Dazzle, but absolute taka stakes stay small. Treat as basket-image tools, not core margin battlegrounds.
Recommended Monitoring List: 50 SKU Families
This monitoring list is built on a simple principle: track the SKUs where the spread is large enough that being out of position costs Vision real conversion and real margin. The 50 families below are ranked within their categories by spread size, absolute taka gap, and observed repricing activity. Anything on this list that Vision does not monitor at least weekly is a competitive blind spot.
Phones (Top 16)
| SKU Family | Why Watch |
|---|---|
| Samsung Galaxy S24 FE 5G | Highest observed phone spread at 81.3%; also active repricing at Gadget & Gear |
| Samsung Galaxy S24 Ultra 5G | Largest absolute phone gap at ৳131,600; Dazzle-led undercut |
| Samsung Galaxy S25 Plus 5G | Early-life premium Android gap at 53.8% |
| iPhone 15 Plus | Late-cycle Apple value pocket with 60.6% spread |
| iPhone 16e | Fast early decay: 42.0% cross-retailer spread and 31.7% swing at AppleGadgets |
| iPhone 16 | Mid-cycle flagship with 39.3% spread |
| iPhone 16 Plus | 38.3% spread; still wide for a current-generation Plus line |
| iPhone 15 Pro | 36.3% spread; premium carryover-value play |
| iPhone 16 Pro Max | 34.8% spread; large absolute taka gap |
| iPhone 15 | 33.5% spread; low entry point into Apple ecosystem |
| iPhone 16 Pro | 32.1% spread; premium Apple traffic driver |
| OnePlus 13 | 27.6% spread; Star Tech undercuts Dazzle |
| iPhone 15 Pro Max | 26.1% spread; Star Tech changed price eight times |
| Google Pixel 9 | 24.0% spread; Dazzle leads |
| Google Pixel 8 Pro | 12.9% spread; narrower but still material |
| Pixel 9a | New-launch watch item; 5.7% spread but strong lifecycle relevance |
The iPhone 16 line spans spreads of 32–42% even though these are current-generation phones launched only months before the observation window. In Bangladesh's competitive online electronics market, "new" does not protect a price. Within weeks of launch, AppleGadgets establishes a lower price corridor and the gap between retailers widens rapidly. Vision's most important pricing discipline for iPhone 16 is to close the gap to AppleGadgets on the entry and mid-tier models (16, 16e, 16 Plus) where conversion is highest, while accepting a more comfortable margin position on 16 Pro Max where the buyer is less price-sensitive.
Tablets, Sound, Power & Wearables
| SKU Family | Category | Why Watch |
|---|---|---|
| Galaxy Tab A9 | Tablets | 68.2% spread; AppleGadgets leads decisively |
| Galaxy Tab A8 | Tablets | 57.1% spread; heavy value-sensitive tablet pocket |
| iPad Air M3 11 inch 2025 | Tablets | 58.5% swing at AppleGadgets and 22.2% swing at Dazzle |
| Galaxy Tab S10+ | Tablets | 30.8% spread; premium Android tablet gap |
| iPad mini 7 | Tablets | 27.7% spread; AppleGadgets leads |
| Galaxy Tab A9+ Wi-Fi 4/64GB | Tablets | 40.3% swing at Star Tech with five changes |
| Apple AirPods 3rd Generation | Sound Equipment | 48.6% spread; Dazzle leads |
| Yison Celebrat SP-8 | Sound Equipment | 23.4% spread; Star Tech leads on value audio |
| Apple AirPods 2nd Generation | Sound Equipment | 20.8% spread; stable conversion line |
| Marshall Emberton III | Sound Equipment | 13.3% spread between Dazzle and Gadget & Gear |
| Xiaomi 120W GaN USB-C Charger | Power & Accessories | Largest power-accessory spread at 96.6% |
| Apple World Travel Adapter Kit | Power & Accessories | 28.4% spread; AppleGadgets undercuts Dazzle |
| Samsung 10000mAh Battery Pack 25W | Power & Accessories | 195.5% swing at AppleGadgets; extreme promo sensitivity |
| XINJI Nothing 2 Smart Watch | Wearables | 39.1% spread; Star Tech leads |
| Amazfit Active | Wearables | 18.1% spread; Gadget & Gear undercuts Dazzle |
| Asus TUF Gaming A15 FA507NUR | Laptop & Desktop | 16.9% spread; AppleGadgets leads |
| MacBook Air 13 M3 24/512GB | Laptop & Desktop | 22.3% swing at Gadget & Gear; high-ticket Apple laptop |
The Samsung 10000mAh Battery Pack had a 195.5% price swing at AppleGadgets — meaning the same power bank sold for nearly three times its lowest observed price at different points during the observation period. This is an extreme example of how accessories can become unintentional price credibility destroyers: a shopper who bought this battery pack at the high point and later saw it at a third of that price would have a lasting negative impression of the retailer that sold it to them. Vision should set hard ceiling rules on accessory price swings — not to leave money on the table, but to protect the trust that drives repeat phone and tablet purchases.
Conclusion
Bangladesh's online electronics market is not a single battlefield — it is five distinct retailer personas operating simultaneously with different strategies and different category strengths. The central insight from 43 matched SKU families across four months of daily observation is that Vision cannot win by being universally competitive. It wins by being precisely competitive on the SKUs that matter most to conversion, in the categories where the taka stakes are highest, on the platforms where the price-sensitive buyer is making their decision.
The two categories that demand the most attention are phones and tablets, where an average retailer gap of ৳52,502 and ৳16,216 per SKU respectively means that being out of position on even three or four hero lines can represent hundreds of lakhs in lost annual revenue. AppleGadgets is the benchmark to match on iPhone and iPad. Dazzle is the benchmark to watch for Samsung flagship events. Star Tech is the benchmark to alert on in tablets and audio accessories.
The most important operational change Vision can make is to build a daily monitoring system for the 16 phone families and 17 tablet/accessory families on the recommended monitoring list. Every day those prices are not tracked is a day that a Dazzle markdown or an AppleGadgets undercut reshapes shopper expectations before Vision can respond. In a market where the Galaxy S25 Plus already shows a 53.8% spread within five months of launch, and where the iPhone 16e is decaying at 31.7% within its own retailer within 87 days, slow monitoring is not a luxury the market affords.
